The Property Tax Highlights publication for fiscal year 2016-17 released today shows that the total annual countywide tax levy was $2.4 billion — $163.2 million more than the prior year.
Although the increase in revenues is part of a multi-year positive trend, County Controller Juan Raigoza explained that local government agencies’ operating costs, which are largely impacted by the cost of doing business in the San Francisco Bay Area, have also increased in recent years.
“While the County and most local government agencies have recently experienced significant growth in their annual property tax revenues due to the growing economy, in the long term, this is unlikely to be sustainable. Historically, good economic times have not gone on indefinitely. Furthermore, as the cost of providing essential services continue to increase, the County and other local agencies should continue to think long term and plan appropriately,” Raigoza said.
Raigoza, a countywide elected official, has the independent duty and responsibility for distributing taxes to 131 local government agencies (cities, county, school districts, and special districts) within the county. The publication shows taxpayers and all county residents the totality of those revenues and the recipients.
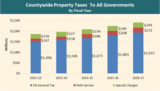
The graph above illustrates the annual tax levy for the past five years. It includes the total taxes billed to property owners on locally and state-assessed properties within the county. The countywide annual tax levy has increased by $553 million (30 percent), from fiscal year 2012-13 to 2016-17, due to increases in the 1 percent General Tax ($441 million), Debt Service ($84 million), and Special Charges ($28 million).
Pursuant to Proposition 13, the General Tax is always 1 percent. The increase of General Tax revenues resulted from annual growth in assessed values. Countywide, in fiscal year 2016-17, the 1 percent General Tax totaled $1.9 billion, of which 46 percent went to schools, 25 percent to the County, 16 percent to cities, 11 percent to special districts, and 2 percent to former redevelopment agencies.
The increases to Debt Service was due to additional voter-approved school bonds to fund building and maintenance projects. While total Debt Service amounts collected have increased, the overall tax rates have remained fairly consistent during the past five years. For comparison purposes, the average property tax rate (1 percent General Tax plus Debt Service) in the county was 1.09 percent in FY 2012-13 and 1.11 percent in FY 2016-17.
Special charges increased primarily due to increases in sewer and sanitary charges imposed by various local agencies.
The complete Property Tax Highlights publication is available at: http://controller.smcgov.org/2017-pth
Other County financial information documents including the Comprehensive Annual Financial Report (CAFR) and Financial Highlights Report are available at www.smcgov.org/controller.