San Mateo County Shared Prosperity Coordinating Council
The Community Data Dashboard presents key metrics that provide insight into the community’s current economic mobility conditions and trends over time. It demonstrates a Targeted Universalism approach to better understand the varied conditions that different populations experience. Economic mobility metrics are disaggregated by race and local jurisdiction, and by age, gender, and other factors when available. This disaggregated data shows which subpopulations may be most challenged and need targeted support, and what populations have strong outcomes that can we learn from.
Experience the Community Data Dashboard in full-screen mode
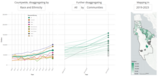
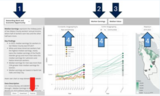
The Dashboard presents three data displays: Demographics, Community, and Geography.
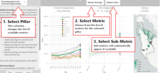
How to navigate the dashboard:
-
Select Pillar from top left dropdown
-
Select Metric for the selected pillar
-
Select Sub-Metric if available
-
View different datasets by selectingfrom the white dropdown menus aboveeach view
Select the ‘Tutorial’ button at the bottomleft corner for a comprehensive walk-through of dashboard features.
What metrics are included in the dashboard?
Rewarding Work & Economic Opportunity
Metric |
What it Shows |
|
Midway point of San Mateo County workers’ annual income, where half of workers earn less and the other half earn more. |
|
|
Individuals with annual earnings within the selected dollar range (<$10k, $10-25k, $25-50k, $50-75k, $75-100k, >$100k.) |
|
|
Middle price of all homes in the selected geography, where half of all homes are worth less and half of the homes are worth more. |
|
|
Residents living in owner-occupied housing |
|
|
Residents age 16 or older who are employed. |
|
|
Workers in each occupation type including the following sectors: management, business, science, arts; service; sales and office; natural resources, construction and maintenance sectors; production, transportation and shipping. |
|
|
Utilization of benefits |
TBD |
High-Quality Education & Information
Metric |
What it Shows |
|
Educational Attainment |
Highest level of schooling attained. |
|
Digital Access |
Households with in-home access to a computer and the internet. |
|
Preschool Enrollment |
3-4 year old children who are enrolled in nursery school or preschool. |
|
Effective Public Education |
Third-grade students who meet or exceed proficiency standards in Math or English at the end of third grade |
|
School Economic Diversity |
Total student enrollment for K-12 by race/ethnicity, sex, and socioeconomic status. |
|
Disconnected Youth |
Population aged 16 to 24 who are not attending school and not employed. |
Opportunity-Rich & Inclusive Neighborhoods
Metric |
What it Shows |
|
Renter Cost Burden |
Renters who spend 30% or more and 50% or more of their household income on rent. |
|
Homeowner Cost Burden |
Homeowners who spend 30% or more and 50% or more of their household income on their mortgage. |
|
Unmortgaged Homeowners |
Homeowners who do not have a mortgage yet spend more than 30% and 50% of their income on other housing expenses, such as property taxes and insurance, homeowner association fees, and utilities. |
|
Student Homelessness |
Enrolled students who are experiencing homelessness and housing instability. |
|
Eviction Lawsuits |
Eviction lawsuit rate over time. The eviction lawsuit rate is calculated by dividing the number of eviction lawsuits by the total number of renter households in each jurisdiction. |
|
Overcrowdedness |
Percentage of the population that lives in a household with more than one person per room (excluding bathrooms and hallways). |
|
Exposure to neighbors of different identity |
Calculates separately for each racial or ethnic group the average share of that group's neighbors who are members of other racial or ethnic groups. |
|
Experiencing racial/cultural intolerance |
Percentage of adults 18 years and older who reported the tolerance in their community for people of different races or cultural backgrounds as 'fair or poor' on the San Mateo County Health and Quality of Life Survey. Data is available by race/ethnicity, sex, age, education level, poverty level, and sexual orientation. |
|
Experiencing Racial Discrimination – emotional symptoms |
Percentage of adults 18 years and older who reported feeling emotionally upset (angry, sad, or frustrated) as a result of how they were treated based on their race in the past 30 days. |
|
Experiencing racial discrimination – physical symptoms |
Percentage of adults 18 years and older who reported experiencing any physical symptoms (such as upset stomach, tensing of muscles, pounding heart) as a result of how they were treated based on their race in the past 30 days. |
|
Geographic Mobility |
Measures residential changes—the percentage of the population that has stayed in their home, moved elsewhere in the County or State, or out-of-state in the past year. |
|
Commute mode |
Percentage of San Mateo County residents that use a specific mode of transportation to and from their residence to get to their workplace (in or out of San Mateo County). Modes include single-occupancy vehicle, carpool, public transit, walk, and bike. |
|
Proximity to bus transit |
Percent of residents who live within a half-mile of bus stops with frequent weekday service. |
Healthy Environment & Healthcare
Metric |
What it Shows |
|
Mental Health |
Adults aged ≥ 18 years who report that their mental health (including stress, depression, and problems with emotions) was not good for 14 or more days during the past 30 days |
|
Uninsured |
Residents without active health insurance coverage. |
|
Public Assistance or SNAP |
Residents receiving public benefits, such as direct financial assistance programs or food assistance, in the past 12 months. |
|
Within Half-Mile of Groundwater Contamination |
Residents who live within a half-mile of groundwater contamination sites. |
|
Within Half-Mile of Grocery Store |
Residents who live within a half-mile of a grocery store (i.e., authorized SNAP retailers). |
Responsive & Just Institutions
Metric |
What it Shows |
|
Voter Turnout |
Registered voters who actually voted. |
|
Within Half-Mile of Social Services |
Residents living within a half-mile of at least two distinct social services out of the following categories: children and family; counseling and therapy; disabilities; financial; basic needs (including food, clothing, and shelter); health; law and order; libraries; and youth. |
|
Experiencing Difficulty Accessing Social Services |
Adults 18 years and older who reported the ease of getting social services in the community as 'fair or poor' on the San Mateo County Health and Quality of Life Survey. |
How do I navigate and view different metrics?
What types of information does the dashboard include?
How do I download data?
How were these metrics selected?
Why do some metrics not include all groups or cities?
What regional data sets are available?
Metropolitan Transportation Commission and the Association of Bay Area Governments Bay Area Census Data https://census.bayareametro.gov/ and GIS Data Catalogue https://opendata.mtc.ca.gov/
Bay Area Equity Atlas https://bayareaequityatlas.org/indicators